3D图形在数据分析、数据建模、图形和图像处理等领域中都有着广泛的应用,下面将给大家介绍一下如何使用python进行3D图形的绘制,包括3D散点、3D表面、3D轮廓、3D直线(曲线)以及3D文字等的绘制。
准备工作:
python中绘制3D图形,依旧使用常用的绘图模块matplotlib,但需要安装mpl_toolkits工具包,安装方法如下:windows命令行进入到python安装目录下的Scripts文件夹下,执行: pip install --upgrade matplotlib即可;linux环境下直接执行该命令。
安装好这个模块后,即可调用mpl_tookits下的mplot3d类进行3D图形的绘制。
下面以实例进行说明。
1、3D表面形状的绘制
from mpl_toolkits.mplot3d import Axes3D import matplotlib.pyplot as plt import numpy as np fig = plt.figure() ax = fig.add_subplot(111, projection='3d') # Make data u = np.linspace(0, 2 * np.pi, 100) v = np.linspace(0, np.pi, 100) x = 10 * np.outer(np.cos(u), np.sin(v)) y = 10 * np.outer(np.sin(u), np.sin(v)) z = 10 * np.outer(np.ones(np.size(u)), np.cos(v)) # Plot the surface ax.plot_surface(x, y, z, color='b') plt.show()
球表面,结果如下:

2、3D直线(曲线)的绘制
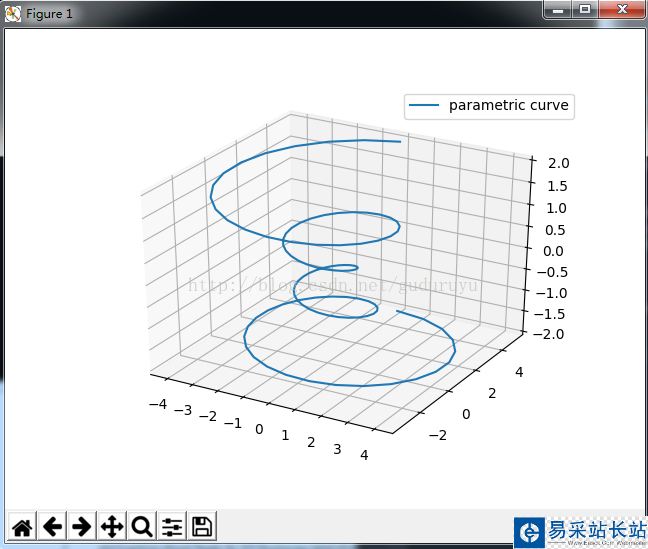
import matplotlib as mpl from mpl_toolkits.mplot3d import Axes3D import numpy as np import matplotlib.pyplot as plt mpl.rcParams['legend.fontsize'] = 10 fig = plt.figure() ax = fig.gca(projection='3d') theta = np.linspace(-4 * np.pi, 4 * np.pi, 100) z = np.linspace(-2, 2, 100) r = z**2 + 1 x = r * np.sin(theta) y = r * np.cos(theta) ax.plot(x, y, z, label='parametric curve') ax.legend() plt.show()
这段代码用于绘制一个螺旋状3D曲线,结果如下:
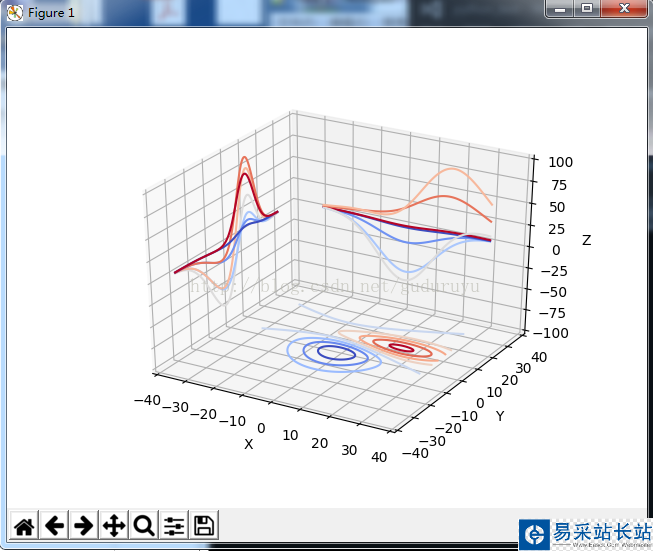
3、绘制3D轮廓
from mpl_toolkits.mplot3d import axes3d import matplotlib.pyplot as plt from matplotlib import cm fig = plt.figure() ax = fig.gca(projection='3d') X, Y, Z = axes3d.get_test_data(0.05) cset = ax.contour(X, Y, Z, zdir='z', offset=-100, cmap=cm.coolwarm) cset = ax.contour(X, Y, Z, zdir='x', offset=-40, cmap=cm.coolwarm) cset = ax.contour(X, Y, Z, zdir='y', offset=40, cmap=cm.coolwarm) ax.set_xlabel('X') ax.set_xlim(-40, 40) ax.set_ylabel('Y') ax.set_ylim(-40, 40) ax.set_zlabel('Z') ax.set_zlim(-100, 100) plt.show()绘制结果如下:
4、绘制3D直方图
from mpl_toolkits.mplot3d import Axes3D import matplotlib.pyplot as plt import numpy as np fig = plt.figure() ax = fig.add_subplot(111, projection='3d') x, y = np.random.rand(2, 100) * 4 hist, xedges, yedges = np.histogram2d(x, y, bins=4, range=[[0, 4], [0, 4]]) # Construct arrays for the anchor positions of the 16 bars. # Note: np.meshgrid gives arrays in (ny, nx) so we use 'F' to flatten xpos, # ypos in column-major order. For numpy >= 1.7, we could instead call meshgrid # with indexing='ij'. xpos, ypos = np.meshgrid(xedges[:-1] + 0.25, yedges[:-1] + 0.25) xpos = xpos.flatten('F') ypos = ypos.flatten('F') zpos = np.zeros_like(xpos) # Construct arrays with the dimensions for the 16 bars. dx = 0.5 * np.ones_like(zpos) dy = dx.copy() dz = hist.flatten() ax.bar3d(xpos, ypos, zpos, dx, dy, dz, color='b', zsort='average') plt.show()
新闻热点


疑难解答