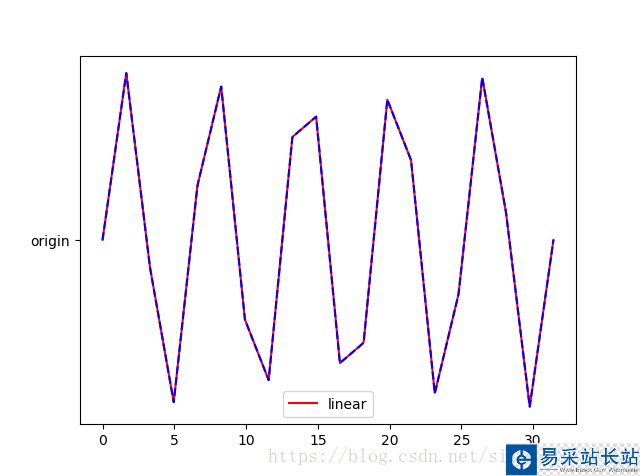
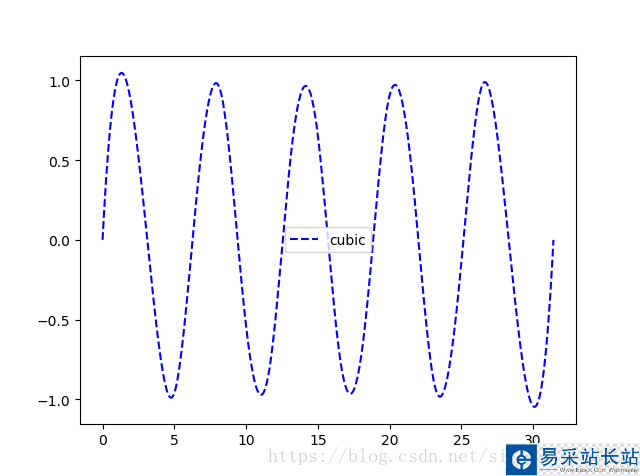
具体代码如下所示:
import numpy as npfrom matplotlib import pyplot as pltfrom scipy.interpolate import interp1dx=np.linspace(0,10*np.pi,num=20)y=np.sin(x)f1=interp1d(x,y,kind='linear')#线性插值f2=interp1d(x,y,kind='cubic')#三次样条插值x_pred=np.linspace(0,10*np.pi,num=1000)y1=f1(x_pred)y2=f2(x_pred)plt.figure()plt.plot(x_pred,y1,'r',label='linear')plt.plot(x,f1(x),'b--','origin')plt.legend()plt.show()plt.figure()plt.plot(x_pred,y2,'b--',label='cubic')plt.legend()plt.show()


总结
以上所述是小编给大家介绍的python中的插值 scipy-interp的实现代码,希望对大家有所帮助,如果大家有任何疑问请给我留言,小编会及时回复大家的。在此也非常感谢大家对武林站长站网站的支持!
新闻热点
疑难解答