首先要将EnyimMemcached安装至Windows Performance Counters中。
安装成功后,就能在Performance Monitor中看到了。
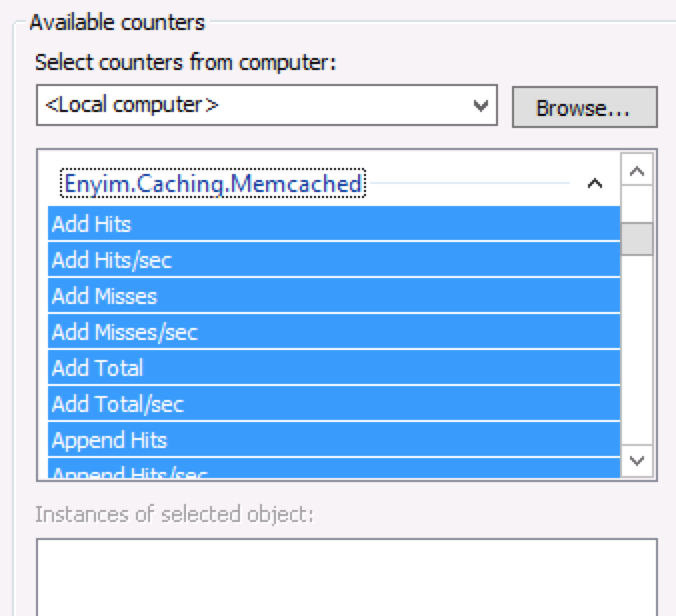
虽然在counters的列表中出现了,但是下面的Instances of selected object中却是空白,于是无法将计数器添加到Performance Monitor中。
在配置过程中,在这个地方卡了很长时间。。。
卡在这里完全是怪自己竟然没发现EnyimMemcached的帮助文档:Configure the Performance Monitor。
原来还需要在应用程序中进行配置,要在web.config中添加<performanceMonitor/>的配置:

<enyim.com> <memcached PRotocol="Binary"> <servers> <add address="memcached" port="11211" /> </servers> <socketPool minPoolSize="50" maxPoolSize="3000" connectionTimeout="00:00:01" deadTimeout="00:00:01"/> <performanceMonitor factory="Enyim.Caching.Memcached.DefaultPerformanceMonitorFactory, Enyim.Caching" name="www.VEVb.com"/> </memcached> <log factory="Enyim.Caching.Log4NetFactory, Enyim.Caching.Log4NetAdapter" /></enyim.com>
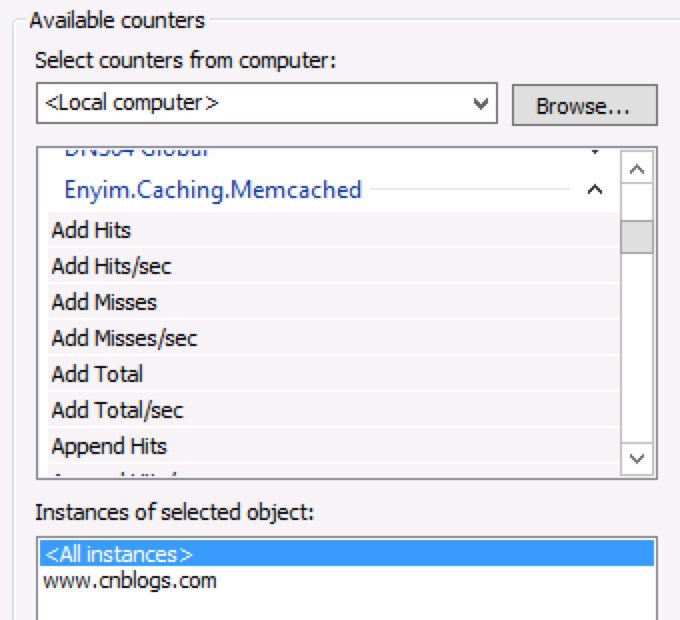
然后访问一下站点,将asp.net程序启动起来后,就能在Instances of selected object中看到性能计数器的实例了。
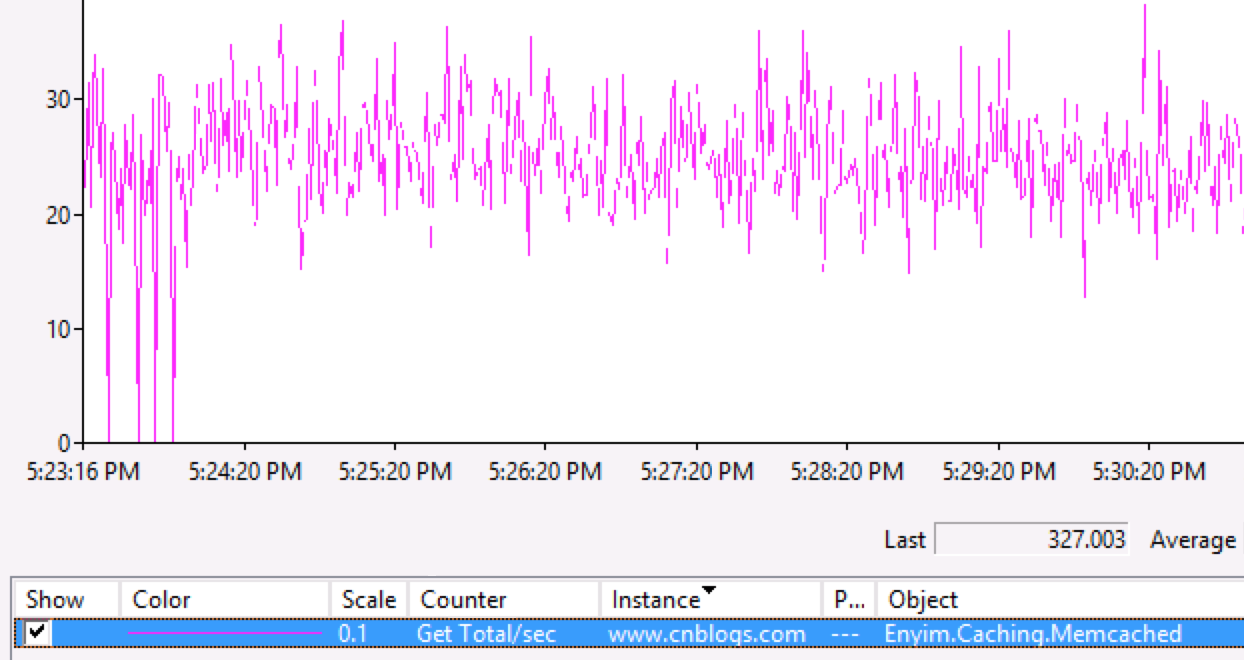
我们选择一个指标体验一下:

监测结果如下:
新闻热点


疑难解答