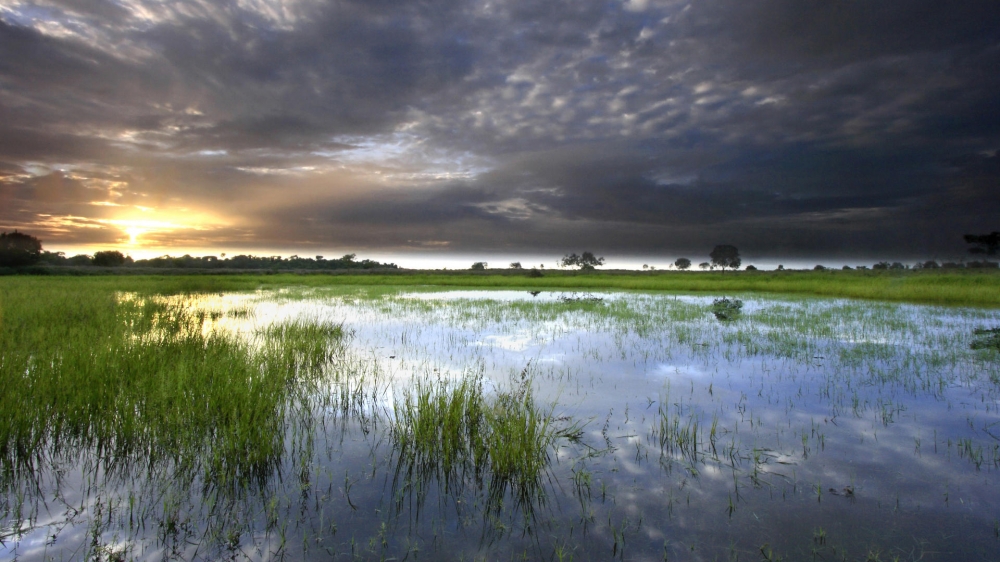
先上原图:

下面是程序:
rgb = imread('你图片文件');%读取原图像I = rgb2gray(rgb);%转化为灰度图像figure; subplot(121)%显示灰度图像imshow(I)text(732,501,'Image courtesy of Corel',... 'FontSize',7,'HorizontalAlignment','right')hy = fspecial('sobel');%sobel算子hx = hy';Iy = imfilter(double(I), hy, 'replicate');%滤波求y方向边缘Ix = imfilter(double(I), hx, 'replicate');%滤波求x方向边缘gradmag = sqrt(Ix.^2 + Iy.^2);%求摸subplot(122); imshow(gradmag,[]), %显示梯度title('Gradient magnitude (gradmag)')L = watershed(gradmag);%直接应用分水岭算法Lrgb = label2rgb(L);%转化为彩色图像figure; imshow(Lrgb), %显示分割后的图像title('Watershed transform of gradient magnitude (Lrgb)')se = strel('disk', 20);%圆形结构元素Io = imopen(I, se);%形态学开操作figure; subplot(121)imshow(Io), %显示执行开操作后的图像title('Opening (Io)')Ie = imerode(I, se);%对图像进行腐蚀Iobr = imreconstruct(Ie, I);%形态学重建subplot(122); imshow(Iobr), %显示重建后的图像title('Opening-by-reconstruction (Iobr)')Ioc = imclose(Io, se);%形态学关操作figure; subplot(121)imshow(Ioc), %显示关操作后的图像title('Opening-closing (Ioc)')Iobrd = imdilate(Iobr, se);%对图像进行膨胀Iobrcbr = imreconstruct(imcomplement(Iobrd), ... imcomplement(Iobr));%形态学重建Iobrcbr = imcomplement(Iobrcbr);%图像求反subplot(122); imshow(Iobrcbr), %显示重建求反后的图像title('Opening-closing by reconstruction (Iobrcbr)')fgm = imregionalmax(Iobrcbr);%局部极大值figure; imshow(fgm), %显示重建后局部极大值图像title('Regional maxima of opening-closing by reconstruction (fgm)')I2 = I;I2(fgm) = 255;%局部极大值处像素值设为255figure; imshow(I2), %在原图上显示极大值区域title('Regional maxima superimposed on original image (I2)')se2 = strel(ones(5,5));%结构元素fgm2 = imclose(fgm, se2);%关操作fgm3 = imerode(fgm2, se2);%腐蚀fgm4 = bwareaopen(fgm3, 20);%开操作I3 = I;I3(fgm4) = 255;%前景处设置为255figure; subplot(121)imshow(I3)%显示修改后的极大值区域title('Modified regional maxima')bw = im2bw(Iobrcbr, graythresh(Iobrcbr));%转化为二值图像subplot(122); imshow(bw), %显示二值图像title('Thresholded opening-closing by reconstruction')D = bwdist(bw);%计算距离DL = watershed(D);%分水岭变换bgm = DL == 0;%求取分割边界figure; imshow(bgm), %显示分割后的边界title('Watershed ridge lines (bgm)')gradmag2 = imimposemin(gradmag, bgm | fgm4);%置最小值L = watershed(gradmag2);%分水岭变换I4 = I;I4(imdilate(L == 0, ones(3, 3)) | bgm | fgm4) = 255;%前景及边界处置255figure; subplot(121)imshow(I4)%突出前景及边界title('Markers and object boundaries')Lrgb = label2rgb(L, 'jet', 'w', 'shuffle');%转化为伪彩色图像subplot(122); imshow(Lrgb)%显示伪彩色图像title('Colored watershed label matrix')figure; imshow(I), hold onhimage = imshow(Lrgb);%在原图上显示伪彩色图像set(himage, 'AlphaData', 0.3);title('Lrgb superimposed transparently on original image')
最后得到一个清晰的海岸线图像:
新闻热点


疑难解答