如何设置图表网格线
在Excel 2010中,用户可根据需要设定分类坐标的网格线。如果设置太多网格线,会让图表显得杂乱,用户可根据需要来设置网格线。
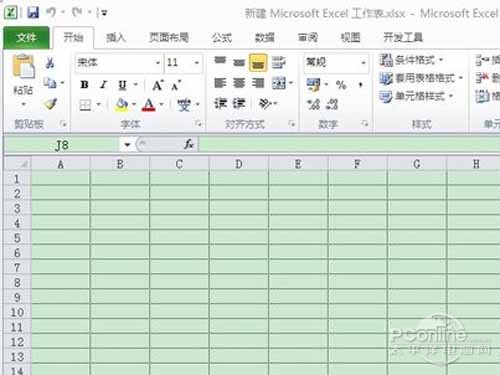
步骤1:按【Ctrl+0】组合键,打开一个Excel工作簿,选择需要设置网格线的图表,如下图所示。


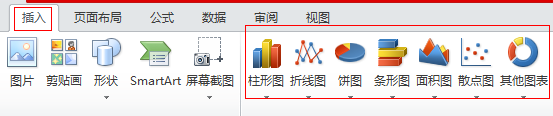
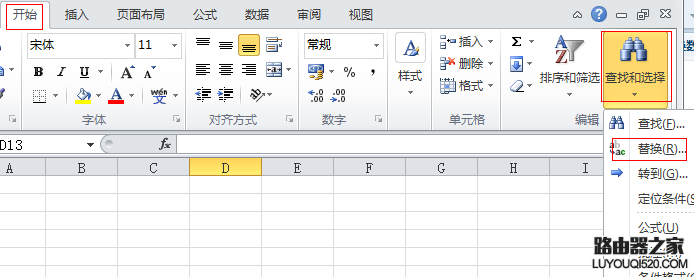
步骤2:切换至“布局”面板,在“坐标轴”选项板中单击“网格线”按钮圈,在弹出的列表框中选择“主要横网格线”I“主要网格线”选项,如下图所示。

(到底wifi是什么,wifi上网是什么意思?http://www.VeVb.com/html/xwzx/6645.html)
步骤3:执行操作后,即可添加图表网格线,效果如下图所示。

新闻热点


疑难解答