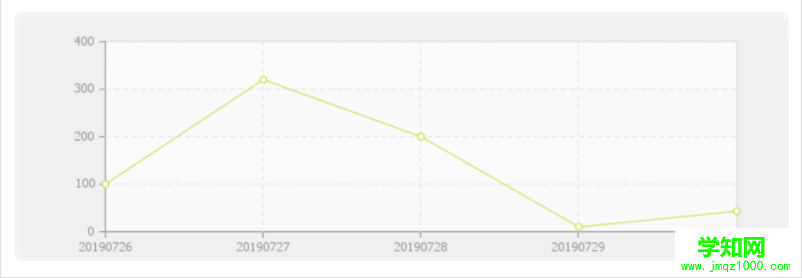
生成折线图
include("pChart/pData.html' target='_blank'>class"); include("pChart/pChart.class"); // Dataset definition$DataSet = new pData;$DataSet->AddPoint(array(100,320,200,10,43),"Serie1");$DataSet->AddPoint(array(20190726,20190727,20190728,20190729,20190730),"Serie3");$DataSet->AddSerie("Serie1");$DataSet->SetAbsciseLabelSerie("Serie3");// Initialise the graph $Test = new pChart(700,230);$Test->setFontProperties("Fonts/tahoma.ttf",8);$Test->setGraphArea(85,30,650,200);$Test->drawFilledRoundedRectangle(7,7,693,223,5,240,240,240);$Test->drawRoundedRectangle(5,5,695,225,5,230,230,230);$Test->drawGraphArea(255,255,255,TRUE);$Test->drawScale($DataSet->GetData(),$DataSet->GetDataDescription(),SCALE_NORMAL,150,150,150,TRUE,0,2);$Test->drawGrid(4,TRUE,230,230,230,50);$Test->setFontProperties("Fonts/tahoma.ttf",6);$Test->drawTreshold(0,143,55,72,TRUE,TRUE);$Test->drawLineGraph($DataSet->GetData(),$DataSet->GetDataDescription());$Test->drawPlotGraph($DataSet->GetData(),$DataSet->GetDataDescription(),3,2,255,255,255);//生成图表$imageFile = "1.png";$Test->Render($imageFile);echo '<img src="'.$imageFile.'">';
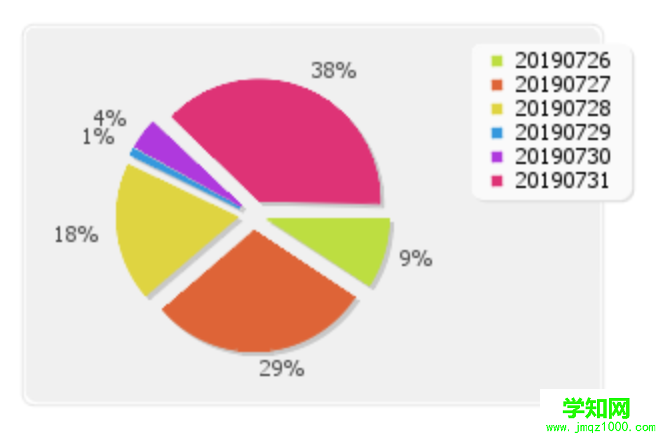
生成饼图
<?php /* Example13: A 2D exploded pie graph */ // Standard inclusions include("pChart/pData.class"); include("pChart/pChart.class"); // Dataset definition $DataSet = new pData; $DataSet->AddPoint(array(100,320,200,10,43,417),"Serie1"); $DataSet->AddPoint(array("20190726","20190727","20190728","20190729","20190730","20190731"),"Serie2"); $DataSet->AddAllSeries(); $DataSet->SetAbsciseLabelSerie("Serie2"); // Initialise the graph $Test = new pChart(500,200); $Test->setFontProperties("Fonts/tahoma.ttf",8); $Test->drawFilledRoundedRectangle(7,7,293,193,5,240,240,240); $Test->drawRoundedRectangle(5,5,295,195,5,230,230,230); // Draw the pie chart $Test->AntialiasQuality = 0; $Test->setShadowProperties(2,2,200,200,200); $Test->drawFlatPieGraphWithShadow($DataSet->GetData(),$DataSet->GetDataDescription(),120,100,60,PIE_PERCENTAGE,8); $Test->clearShadow(); $Test->drawPieLegend(230,15,$DataSet->GetData(),$DataSet->GetDataDescription(),250,250,250); $imageFile = 'example12.png'; $Test->Render($imageFile);echo '<img src="'.$imageFile.'">';?>
相关推荐:《PHP教程》
以上就是PHP生成折线图和饼图等的详细内容,更多请关注 其它相关文章!
郑重声明:本文版权归原作者所有,转载文章仅为传播更多信息之目的,如作者信息标记有误,请第一时间联系我们修改或删除,多谢。
新闻热点
疑难解答